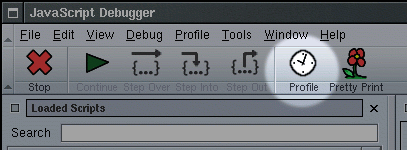
Venkman's Profile feature can be used to measure execution times for your scripts. To enable profiling, click on the Profile button in the toolbar. While Profiling is enabled, Venkman will collect call count, maximum call duration, minimum call duration, and total call duration for every function called. Once you have Profiling enabled, execute the script you would like to profile. When you are done, click "Profile" again to stop collecting data.
When profiling is enabled you will see a green check mark on the toolbar button, and the menu item will be checked as well.
You may repeat the procedure as required to collect all of the data you are interested in. The profile data will accumulate until you select Profile->Clear Profile Data.
When all of the data has been collected, you can select Save Profile Data As... from either the Profile or the File menus. The output format depends on the file extension you select. The supported formats are HTML, XML, CSV, and plain text. If Venkman does not recognize the file extension, the output will be in plain text. Note that the CSV format can be imported into most spreadsheet applications.
If you would like to save profile data only for specific files, select those files in the Loaded Scripts view (the view supports multiple selections, exactly how to do this depends on your operating system), and choose the Save Profile Data As... option from the context menu. You can clear profile data for selected scripts by using the Clear Profile Data menu item.
For more information on how to use Venkman, please read the FAQ or visit the Home Page.